
TruckOnn Fleet Management System
Role
Product Designer
Platform
Web — Admin Portal
Tools
Figma, FigJam
Market
United States
Duration
8 Weeks
Year
2023
Project Overview
TruckOnn is a cloud-based Fleet Management platform built for logistics companies and freight operators across the United States.
The platform helps operations teams manage fleet activity, monitor trips, track vehicle performance, and streamline dispatch workflows through a centralized web-based system.
My role focused on improving operational clarity, simplifying high-frequency workflows, and designing scalable dashboard experiences for logistics operations.

8 Weeks
Project Duration
13
Key Screens Designed
2
Primary Personas
TruckOnn Fleet Management System
Role
Product Designer
Platform
Web — Admin Portal
Tools
Figma, FigJam
Market
United States
Duration
8 Weeks
Year
2023
Project Overview
TruckOnn is a cloud-based Fleet Management platform built for logistics companies and freight operators across the United States.
The platform helps operations teams manage fleet activity, monitor trips, track vehicle performance, and streamline dispatch workflows through a centralized web-based system.
My role focused on improving operational clarity, simplifying high-frequency workflows, and designing scalable dashboard experiences for logistics operations.
8 Weeks
Project Duration
13
Key Screens Designed
2
Primary Personas
TruckOnn Fleet Management System
Role
Product Designer
Platform
Web — Admin Portal
Tools
Figma, FigJam
Market
United States
Duration
8 Weeks
Year
2023
Project Overview
TruckOnn is a cloud-based Fleet Management platform built for logistics companies and freight operators across the United States.
The platform helps operations teams manage fleet activity, monitor trips, track vehicle performance, and streamline dispatch workflows through a centralized web-based system.
My role focused on improving operational clarity, simplifying high-frequency workflows, and designing scalable dashboard experiences for logistics operations.
8 Weeks
Project Duration
13
Key Screens Designed
2
Primary Personas
Key Features
Fleet Dashboard. Live status overview of all vehicles, KPI summary cards, and quick-access alert feed visible immediately on login.
Live Tracking Map. Real-time GPS map displaying all active trucks with route paths, status colour-coding, and vehicle detail panel.
Driver Management. Complete driver profiles including trip history, license expiry dates, availability status, and performance metrics.
Trip Assignment. Streamlined 4-step guided flow to assign drivers to trips with smart driver-availability filtering.
Analytics & Reports. Interactive dashboards for fuel usage, trip costs, on-time delivery rates, and custom date-range exports.
Alerts & Notifications. Configurable proactive alert system for maintenance due dates, route deviations, and compliance deadlines.
Problem Statement
Fleet management companies across the United States relied on fragmented tools such as spreadsheets, phone calls, and legacy desktop software to manage large vehicle fleets.This created operational blind spots across dispatch, compliance, and reporting workflows — making real-time coordination difficult and increasing operational inefficiencies.
Core Points
No Real-Time Visibility - Dispatchers had no live view of vehicle locations, causing delays and constant miscommunication between teams in the field and the office.
Manual & Error-Prone Processes - Trip assignments and driver scheduling were handled manually via phone and spreadsheets, resulting in costly mistakes and an average assignment time of 18 minutes.
Disconnected Data Sources - Fuel costs, maintenance logs, and trip records existed in separate systems with no single source of truth — requiring three or more tools to produce a single consolidated report.
Compliance Risks - Missed vehicle inspections and expired driver licences created serious legal and safety liabilities, with no proactive warning system in place.
Design Challenge
" How might we give fleet operations teams a single, intuitive portal that brings together real-time tracking, driver management, and actionable analytics — reducing operational chaos and improving decision-making speed? "
Success Metrics
Reduce average trip assignment time by 60% (from 18 minutes to under 7 minutes)
Surface full fleet status in under 10 seconds upon login
Achieve zero missed compliance deadlines through proactive alerts
Consolidate four or more fragmented tools into one unified platform
Research & Discovery
Research was conducted through stakeholder interviews with fleet managers and dispatchers across multiple US-based logistics companies, supplemented by a competitive audit and secondary research on fleet operations workflows.
8
Stakeholder Interviews
Fleet managers, dispatchers, ops leads
5
Competitors Audited
Samsara, Verizon, Fleetio, KeepTruckin
12
Pain Points Mapped
By frequency and business impact
Key Research Findings
Dispatchers check vehicle status 20+ times per day. The dashboard must surface live fleet status as the primary element on load — not buried behind navigation menus or secondary screens.
Average trip assignment takes 18 minutes manually. Users needed a streamlined, guided flow with smart driver-availability filtering to dramatically reduce coordination overhead.
Reports are pulled from three different tools. Data consolidation was the single most requested feature across all interviewees. Frustration with fragmented tooling was unanimous.
Compliance alerts are entirely reactive. Managers only discover compliance issues after they become problems. A proactive, scheduled alert system was identified as critical.


Competitive Analysis
Five leading US fleet management platforms were audited against six key feature dimensions to identify market gaps and opportunities for TruckOnn to differentiate.
Platform | Real-Time Tracking | Driver Mgmt | Analytics | Ease of Use | Pricing |
|---|---|---|---|---|---|
Samsara | Strong | Strong | Advanced | Moderate | $$$ |
Verizon Connect | Strong | Moderate | Moderate | Complex | $$$ |
Fleetio | Limited | Strong | Moderate | Easy | $$ |
KeepTruckin | Strong | Moderate | Basic | Easy | $$ |
TruckOnn | Strong | Strong | Advanced | Simple | $ |
TruckOnn targets the market gap between feature-rich but complex tools (Samsara, Verizon) and simple but limited tools (Fleetio, KeepTruckin) — offering advanced analytics with a clean, approachable interface at a competitive price point.

User Personas
Key Features
Fleet Dashboard. Live status overview of all vehicles, KPI summary cards, and quick-access alert feed visible immediately on login.
Live Tracking Map. Real-time GPS map displaying all active trucks with route paths, status colour-coding, and vehicle detail panel.
Driver Management. Complete driver profiles including trip history, license expiry dates, availability status, and performance metrics.
Trip Assignment. Streamlined 4-step guided flow to assign drivers to trips with smart driver-availability filtering.
Analytics & Reports. Interactive dashboards for fuel usage, trip costs, on-time delivery rates, and custom date-range exports.
Alerts & Notifications. Configurable proactive alert system for maintenance due dates, route deviations, and compliance deadlines.
Problem Statement
Fleet management companies across the United States relied on fragmented tools such as spreadsheets, phone calls, and legacy desktop software to manage large vehicle fleets.This created operational blind spots across dispatch, compliance, and reporting workflows — making real-time coordination difficult and increasing operational inefficiencies.
Core Points
No Real-Time Visibility - Dispatchers had no live view of vehicle locations, causing delays and constant miscommunication between teams in the field and the office.
Manual & Error-Prone Processes - Trip assignments and driver scheduling were handled manually via phone and spreadsheets, resulting in costly mistakes and an average assignment time of 18 minutes.
Disconnected Data Sources - Fuel costs, maintenance logs, and trip records existed in separate systems with no single source of truth — requiring three or more tools to produce a single consolidated report.
Compliance Risks - Missed vehicle inspections and expired driver licences created serious legal and safety liabilities, with no proactive warning system in place.
Design Challenge
" How might we give fleet operations teams a single, intuitive portal that brings together real-time tracking, driver management, and actionable analytics — reducing operational chaos and improving decision-making speed? "
Success Metrics
Reduce average trip assignment time by 60% (from 18 minutes to under 7 minutes)
Surface full fleet status in under 10 seconds upon login
Achieve zero missed compliance deadlines through proactive alerts
Consolidate four or more fragmented tools into one unified platform
Research & Discovery
Research was conducted through stakeholder interviews with fleet managers and dispatchers across multiple US-based logistics companies, supplemented by a competitive audit and secondary research on fleet operations workflows.
8
Stakeholder Interviews
Fleet managers, dispatchers, ops leads
5
Competitors Audited
Samsara, Verizon, Fleetio, KeepTruckin
12
Pain Points Mapped
By frequency and business impact
Key Research Findings
Dispatchers check vehicle status 20+ times per day. The dashboard must surface live fleet status as the primary element on load — not buried behind navigation menus or secondary screens.
Average trip assignment takes 18 minutes manually. Users needed a streamlined, guided flow with smart driver-availability filtering to dramatically reduce coordination overhead.
Reports are pulled from three different tools. Data consolidation was the single most requested feature across all interviewees. Frustration with fragmented tooling was unanimous.
Compliance alerts are entirely reactive. Managers only discover compliance issues after they become problems. A proactive, scheduled alert system was identified as critical.
Competitive Analysis
Five leading US fleet management platforms were audited against six key feature dimensions to identify market gaps and opportunities for TruckOnn to differentiate.
Platform | Real-Time Tracking | Driver Mgmt | Analytics | Ease of Use | Pricing |
|---|---|---|---|---|---|
Samsara | Strong | Strong | Advanced | Moderate | $$$ |
Verizon Connect | Strong | Moderate | Moderate | Complex | $$$ |
Fleetio | Limited | Strong | Moderate | Easy | $$ |
KeepTruckin | Strong | Moderate | Basic | Easy | $$ |
TruckOnn | Strong | Strong | Advanced | Simple | $ |
TruckOnn targets the market gap between feature-rich but complex tools (Samsara, Verizon) and simple but limited tools (Fleetio, KeepTruckin) — offering advanced analytics with a clean, approachable interface at a competitive price point.
User Personas
Two primary personas were defined based on interview findings. These personas guided all design decisions throughout the project.


User Stories
Area | As a... | I want to... | So that... |
|---|---|---|---|
Dashboard | fleet manager | see a live overview of all vehicle statuses on login | I can immediately spot issues without navigating elsewhere |
Trip Assignment | dispatcher | assign a driver to a trip in four steps or fewer | I reduce time spent on logistics coordination |
Vehicle Tracking | fleet manager | see real-time GPS location of each truck on a map | I can monitor route adherence continuously |
Driver Mgmt | admin | view driver profiles including licence expiry dates | I can ensure compliance proactively |
Analytics | manager | generate fuel and trip cost reports by date range | I can identify and act on cost-saving opportunities |
Alerts | admin | receive proactive alerts for maintenance due dates | I can prevent vehicle breakdowns before they occur |
Information Architecture
The sitemap was defined before wireframing to ensure every feature had a logical home and that navigation remained intuitive as the product scaled. The structure directly informed the persistent sidebar navigation used throughout the portal. (Figure shows the full sitemap showing the six primary navigation modules and all sub-page content).

Navigation Design Decisions
Dashboard as Landing Page. The dashboard is always the entry point, providing immediate situational awareness without any additional navigation.
Fleet and Drivers as Separate Modules. Despite overlap, these were separated to match users' existing mental models from their previous workflows.
Analytics at the Top Level. Analytics sits as a primary module — not nested under Fleet — because it is used independently and daily by managers.
Settings Deprioritised. Settings is accessible but visually de-emphasised in the sidebar, as it is rarely needed during active operations.
User Flow Diagrams
Trip assignment was identified as the most frequent and highest-stakes task in the dispatcher's daily workflow. Mapping the flow revealed 11 redundant steps in the previous process, which were reduced to four in TruckOnn.

Flow Design Notes
The decision node for driver availability was the most critical branching point — two recovery paths were designed and tested.
The "Confirm & Save" step sends an automatic notification to the assigned driver, reducing the need for a follow-up phone call.
A draft-save state was introduced after testing revealed dispatchers frequently need to pause mid-assignment.
Low-Fidelity Wireframes
Low-fidelity wireframes were created in FigJam to validate layout, content hierarchy, and navigation structure before any visual design was applied. Three rounds of internal review resolved all structural issues before high-fidelity work began.


Wireframing Principles
Data Density First. Fleet managers need information-dense layouts. Spacious consumer-product patterns were actively avoided.
Fixed Sidebar. The sidebar was tested as both collapsible and fixed. Fixed won across all three review rounds — users preferred always seeing navigation.
Map on Dashboard. Early wireframes placed the live map on a secondary screen. User feedback immediately moved it to the dashboard.
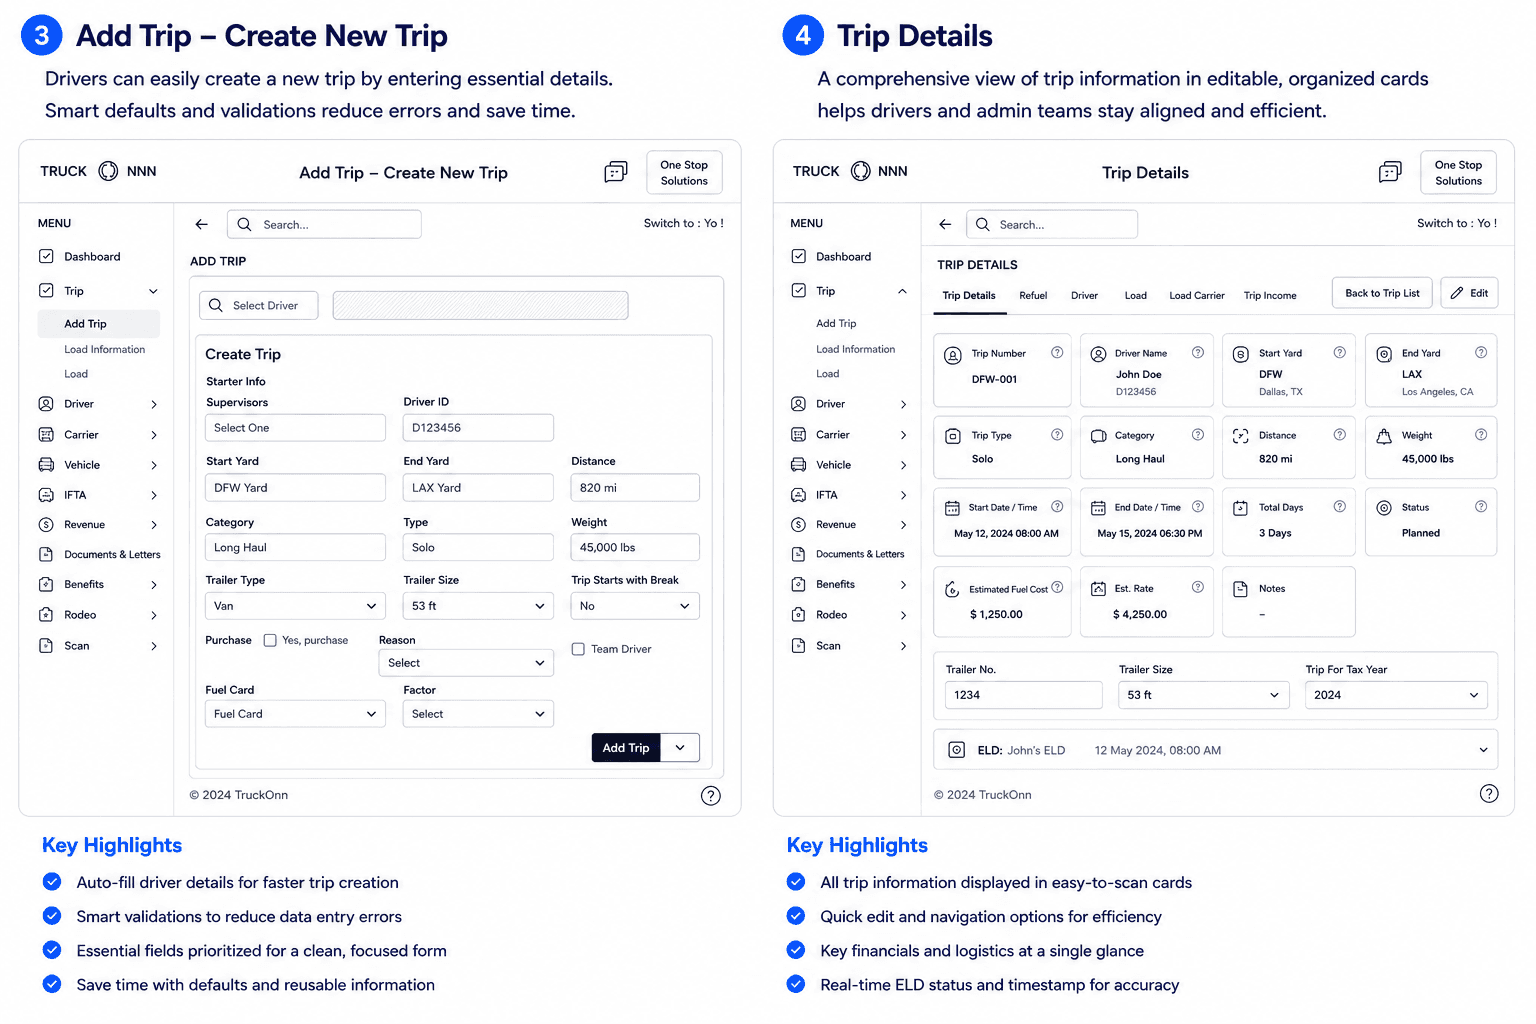
Stepped Trip Form. The trip assignment form was split into a four-step sequence to reduce cognitive load on a complex workflow.
High-Fidelity UI Screens
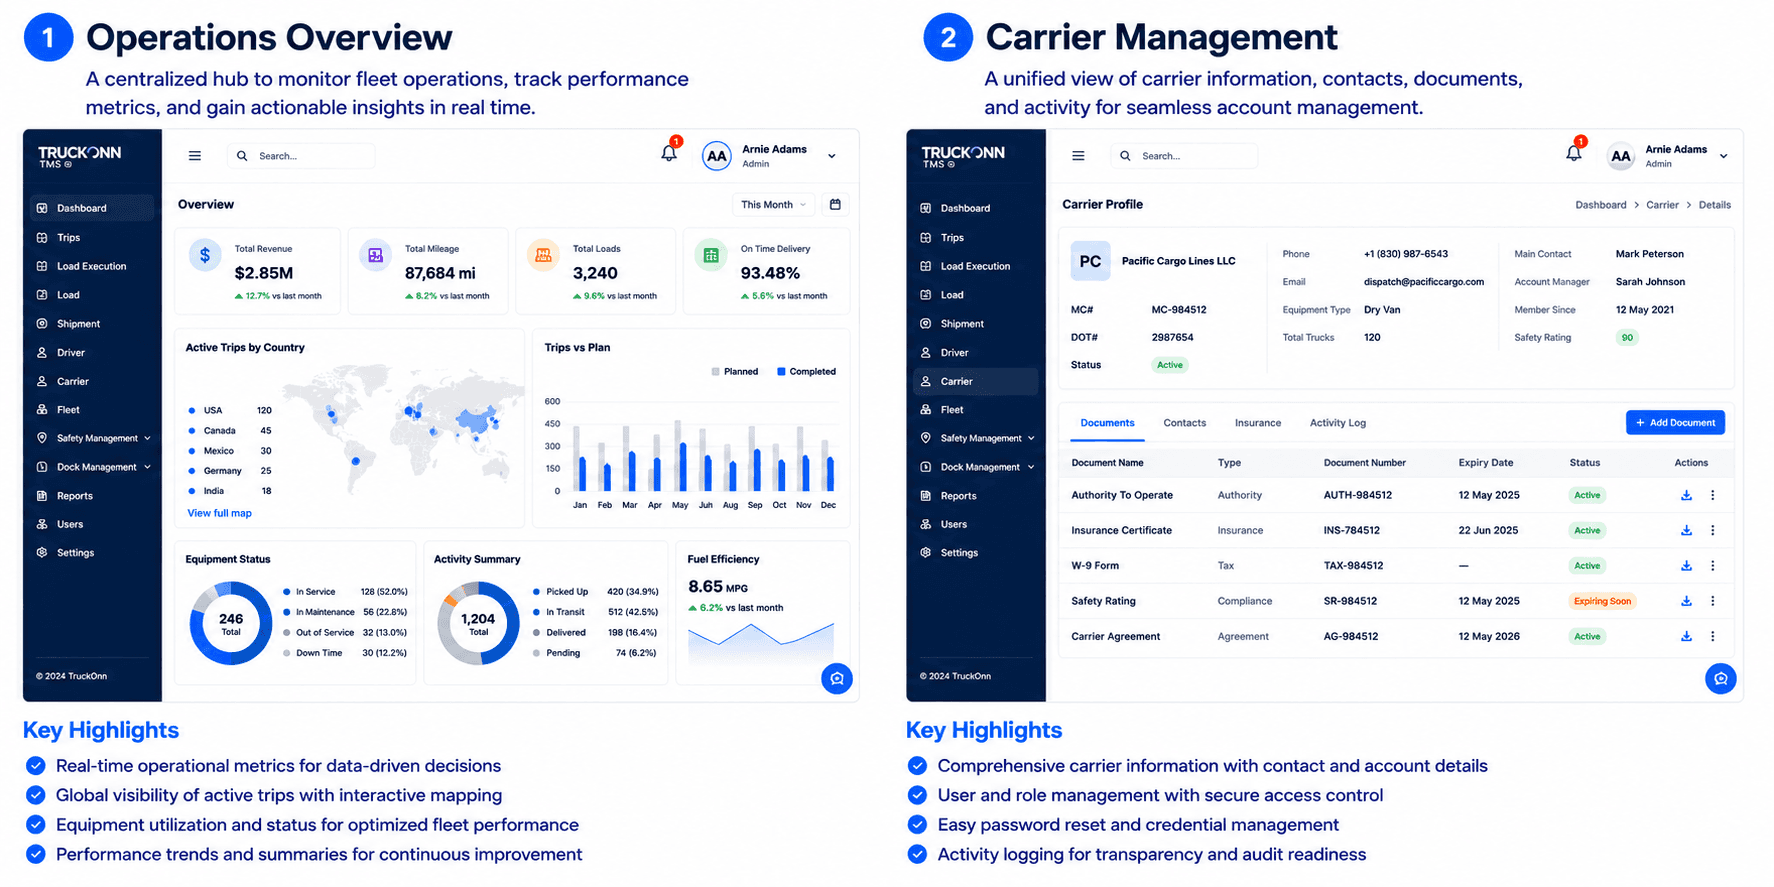
The high-fidelity designs applied the full design system across all key screens. Special attention was paid to data density, visual hierarchy, status colour-coding, and the clarity of primary actions.


Key UI Decisions
Persistent Sidebar Navigation. The fixed sidebar with icon and label ensures users are never disoriented. The active section uses a blue highlight for clear wayfinding.
Table-First Data Layout. Fleet data is consumed in scannable tables rather than cards, allowing rapid comparison across many rows simultaneously.
Live Map on Dashboard. The GPS tracking map is embedded on the main dashboard — not on a secondary screen — reflecting its status as the most-used feature.
Status Colour Coding. Green, orange, red, and grey status indicators are applied consistently across all vehicle, driver, and trip tables.
Design System
A consistent design language was established before high-fidelity work began. The system covers colour, typography, spacing, and reusable components to ensure consistency across all screens.

Design Rationale
Dark Navy Theme. The dark-first palette reduces eye strain during long dispatch shifts and communicates the authority and focus appropriate for enterprise tooling.
Orange as Primary Action Colour. Orange provides high visibility on dark backgrounds without the alarm connotations of red, and is reserved exclusively for calls to action.
Cyan for Informational States. Cyan is used only for informational elements, links, and labels — never for actions — maintaining a clear semantic hierarchy.
Semantic Colour System. Green = active/available, Orange = alert/in-progress, Red = error/expiring. Applied consistently across all screens and tables.
Outcomes & Impact
60%
Faster Trip Assignment
18 min → under 7 min per dispatch
4 → 1
Tools Consolidated
All workflows in one platform
94%
On-Time Delivery Rate
Within first month of rollout
Stakeholder feedback following the design review and usability testing sessions confirmed that the new portal addressed all four core pain points identified during research. Fleet managers reported significant time savings in daily status checks, while dispatchers found the trip assignment flow dramatically faster than their previous process. The proactive compliance alert system was cited as the single most impactful feature.
Impact by Feature Area
Dashboard. Fleet managers can assess full fleet status within 10 seconds of login — previously requiring 5–10 minutes across multiple tools.
Trip Assignment. Assignment time reduced from an average of 18 minutes to under 7 minutes, with near-zero errors due to the guided stepped flow.
Driver Management. Licence expiry and compliance status now tracked proactively, eliminating reactive compliance failures.
Analytics. Monthly cost reports that previously took over an hour to compile can now be generated in under 60 seconds with custom date ranges.
What I Learned
Data density is a feature, not a problem. Fleet managers need information-dense layouts. The instinct to simplify by hiding data behind additional clicks was consistently counterproductive — users needed everything visible at once.
Low-fidelity saves high-fidelity time. Spending three rounds on wireframe reviews before touching Figma components prevented significant late-stage rework. Structure must be validated before style is applied.
The map is the heartbeat of the product. Users consistently returned to the live tracking map above all other features. This moved it from a secondary screen to a persistent dashboard element — one of the most impactful decisions of the project.
Proactive design beats reactive design. The compliance alert system was the most praised feature in testing. Designing for what the system should tell users before they ask became a core principle throughout the project.
Next Steps
Mobile App for Drivers. A companion driver app providing real-time trip updates, turn-by-turn navigation, and digital proof-of-delivery capture.
AI Route Optimisation. ML-powered route suggestions based on real-time traffic, fuel costs, driver hours, and historical delivery performance.
ERP Integration. Two-way sync with SAP, Oracle, and QuickBooks for seamless financial and operational reporting.


Let’s build meaningful product experiences together
© 2026 Arun Ashokk. All rights reserved.
Designed with clarity, usability, and accessibility in mind
Senior Product Designer
Let’s build meaningful product experiences together
© 2026 Arun Ashokk. All rights reserved.
Designed with clarity, usability, and accessibility in mind
Senior Product Designer
Let’s build meaningful product experiences together
© 2026 Arun Ashokk. All rights reserved.
Designed with clarity, usability, and accessibility in mind
Product Designer